

A profitable family entertainment center is not simply the one with the most attractions. The stronger model combines enough visitor volume, disciplined labor and occupancy costs, repeatable party revenue, sensible pricing, and equipment that can move guests through the venue without creating expensive bottlenecks. That is the practical way I’d evaluate Family Entertainment Center ROI: start with annual cash-generating capacity, then work backward into the building, equipment mix, staffing model, and total capital required to open.
The biggest mistake is calculating return from ticket revenue alone. Admissions may bring families through the door, but parties, food and beverage, arcade or paid add-ons, memberships, group events, and repeat visits often determine whether the underlying economics are resilient. At the same time, rent, payroll, utilities, insurance, maintenance, payment fees, consumables, and downtime can quickly absorb revenue that looked attractive in a simple feasibility spreadsheet.

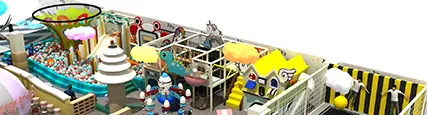
A mixed-attraction concept illustrates why equipment selection and zoning should be evaluated as part of one operating model rather than as separate purchases.
FEC profitability comes from the relationship between capacity, customer spending, operating cost, and invested capital. A busy venue can still produce a disappointing return if rent is excessive, labor is poorly scheduled, attractions require constant repairs, or too much capital was spent creating capacity that the local market cannot fill.
The reverse is also true. A smaller indoor playground business can produce healthy operating economics without spectacular traffic if the site has manageable occupancy costs, strong birthday-party demand, straightforward staffing requirements, good repeat visitation, and a layout that makes productive use of nearly every customer-facing square foot.
For this comparison, I’m prioritizing four measurements rather than treating gross sales as proof of success:
Revenue per paid visit: how much the venue earns from admissions plus secondary spending.
Contribution margin: how much revenue remains after costs that rise directly with attendance.
Operating cash generation: what remains after labor, occupancy, utilities, maintenance, insurance, marketing, and routine administration.
Return on invested capital: whether that operating performance is large enough relative to the money required to build and open the venue.
A $3 million FEC generating $300,000 of annual operating cash before financing produces a very different investment result from a $1.5 million facility producing the same amount. That is why equipment price by itself tells very little about ROI.
I’d recommend forcing every proposed attraction to answer three questions. First, which customer segment does it serve? Second, what revenue or retention function does it perform? Third, what operational burden comes with it? An attraction that looks impressive but serves the same age group and visit occasion as three other attractions may add less commercial value than a smaller zone that opens the venue to toddlers, teens, parties, or group events.
This approach also prevents an expensive design problem: buying attractions first and trying to make the building work afterward. Ceiling height, column spacing, fire exits, accessible routes, HVAC, party rooms, kitchen requirements, visibility, queuing, reception, bathrooms, storage, and staff circulation should be considered before the final equipment plan is frozen.
There is no single universal FEC ROI percentage that should be treated as a benchmark. Lease economics, labor rates, pricing, taxes, construction costs, attraction mix, financing, seasonality, local competition, and customer demographics vary too much. A useful model therefore starts with formulas rather than a claimed industry average.
Simple annual ROI = Annual operating cash surplus ÷ Total invested capital × 100
If total project investment is $1.8 million and the completed venue produces $360,000 per year after normal operating expenses but before debt service, income tax, depreciation, and owner distributions, the simple operating ROI is 20%.
$360,000 ÷ $1,800,000 = 20%
This is useful for comparing concepts, but it is not the same as accounting return, equity return, or investment return after financing. A highly leveraged project can show a different return on owner equity while carrying considerably more financial risk.
Payback period = Total invested capital ÷ Annual operating cash surplus
Using the same example:
$1,800,000 ÷ $360,000 = 5 years
Payback is easy to understand, but it does not account for the time value of money, changes in cash flow, replacement capital, residual value, taxes, or financing. Investors doing a full project analysis should also calculate discounted cash flow, net present value, internal rate of return, debt-service coverage, and downside scenarios.
I’d recommend resisting the temptation to choose a desired ROI first and then adjust assumptions until the spreadsheet reaches it. The better sequence is to estimate realistic attendance, average spending, operating days, party volume, labor hours, rent, maintenance, and other expenses independently. The resulting return is then the output of the model.
| Metric | Calculation | What It Answers |
|---|---|---|
| Annual visits | Average daily paid visits × operating days | How much traffic must the facility support? |
| Admission revenue | Paid visits × average realized admission | What does the core attraction generate? |
| Revenue per visit | Total visit-related revenue ÷ paid visits | Are secondary purchases adding meaningful value? |
| Operating surplus | Total revenue − normal operating expenses | How much cash can the business generate before financing and taxes? |
| Simple ROI | Operating surplus ÷ invested capital | How productive is the original investment? |
| Payback period | Invested capital ÷ annual operating surplus | How long would constant cash flow take to recover the investment? |
Admissions are the foundation of many family entertainment centers, but a venue dependent almost entirely on admission revenue has fewer ways to improve customer value once traffic is inside the building. A stronger amusement center revenue model gives the same visit several legitimate opportunities to generate sales without making the experience feel fragmented.
That broader model is consistent with how the wider amusement industry is structured. The U.S. Census Bureau estimated $9.487 billion in revenue for taxable amusement parks and arcades in the third quarter of 2025. The NAICS 7131 category is much broader than indoor FECs, so this figure should not be interpreted as FEC market size or as an individual-venue revenue benchmark. It does show the scale of paid amusement activity and the importance of treating the business as a full operating category rather than just an equipment purchase.[1]
The admission structure should match capacity and visit length. Common approaches include timed sessions, unlimited-play tickets, attraction bundles, all-access passes, and separate pricing for premium activities. The right model is the one that keeps capacity under control while making the offer easy for parents to understand.
A low entry price is not automatically more profitable. If discounted admissions fill the park during already-busy periods, the venue may create queues and staffing costs without adding enough incremental margin. Off-peak discounts can make more sense when they activate otherwise unused capacity.
Party rooms are not just amenities. They are bookable inventory. Each room has a finite number of sellable time slots each week, making party utilization relatively easy to model.
A party package can combine play admission, reserved room time, food, drinks, decorations, hosts, arcade credits, socks, souvenirs, or premium attractions. The important calculation is not the advertised package price. It is contribution after food, consumables, labor, cleaning time, included admission capacity, and sales commissions or booking fees.
If I were choosing between adding another attraction and adding properly located party capacity, I’d compare their revenue per occupied hour and capital cost rather than assuming the attraction automatically deserves the space.
Food can increase spend and make longer visits easier for families, but it also adds labor, equipment, storage, waste, cleaning, health-code obligations, and potentially more complicated ventilation requirements. The profitable format is not necessarily the largest kitchen.
A limited menu with fast preparation and predictable ingredients can be more appropriate for many play centers than a restaurant-style operation. The decision should come from expected order volume, party requirements, dwell time, and local food-service rules.
Arcades, climbing challenges, interactive games, redemption attractions, premium courses, or other add-ons can raise spend per visit. The risk is placing so many paid upgrades behind the admission gate that parents feel every part of the venue requires another transaction.
I’d choose add-ons that extend the visit or serve an older customer segment rather than simply duplicating the core play experience.
Memberships can create recurring revenue and increase visit frequency, but the accounting model should avoid counting the same visit twice. If members do not buy a normal ticket when they enter, membership revenue should be modeled separately from paid admission visits.
| Revenue Stream | Primary Metric | Main Cost or Capacity Constraint | Question to Test |
|---|---|---|---|
| Admissions | Realized ticket revenue per paid visit | Attraction capacity and staffing | Does pricing remain profitable at peak and off-peak traffic? |
| Birthday parties | Contribution per room-hour | Room availability, hosts, food, turnover time | How many sellable sessions can each room support? |
| Food and beverage | Gross profit per visitor | Labor, waste, kitchen infrastructure | Does the menu justify its operating complexity? |
| Arcade/add-ons | Incremental spend per visitor | Equipment cost, prizes, payment system | Does it add spending without damaging the core experience? |
| Memberships | Monthly revenue and member usage | Peak-time capacity consumption | Are high-frequency members profitable at the times they visit? |
| Groups/private events | Contribution per booked session | Sales effort and schedule availability | Can weekday or off-peak capacity be sold productively? |
FEC startup costs should include every expense necessary to reach an operating opening day, not just the purchase price of family entertainment center equipment. Underestimating the non-equipment portion of the project is one of the easiest ways to turn a workable operating model into an overcapitalized one.
I’d recommend creating separate budgets for the site, equipment, opening, and liquidity reserve. That makes it harder for an attractive equipment quote to hide costs that will arrive later.
| Cost Bucket | Typical Items to Include | Procurement Check |
|---|---|---|
| Lease and premises | Deposits, legal review, initial rent, landlord work, utility deposits | Confirm who pays for structural and building upgrades. |
| Building work | Electrical, HVAC, sprinklers, bathrooms, flooring, partitions, kitchen work, lighting | Price from actual drawings rather than a cost-per-square-foot guess. |
| Play equipment | Soft play, trampoline areas, ninja course, climbing elements, toddler zone | Define exactly what the manufacturer quote includes. |
| Freight and import | Ocean or inland freight, customs, duties, unloading, local delivery | Clarify Incoterms and destination responsibilities. |
| Installation | Manufacturer supervision, local labor, lifting equipment, travel and lodging | Separate equipment assembly from electrical and building trades. |
| Technology | POS, booking system, waivers, access control, networking, cameras, music | Include subscriptions and transaction fees in the operating model. |
| Opening inventory | Food, drinks, socks, merchandise, prizes, cleaning supplies | Model replacement and replenishment after opening. |
| Professional fees | Architect, engineer, permits, inspections, legal and accounting work | Confirm local requirements before signing the equipment contract. |
| Pre-opening payroll | Hiring, manager payroll, staff training, opening preparation | Include weeks when employees are paid before revenue begins. |
| Working capital | Cash reserve for ramp-up and unexpected expenses | Do not assume the venue opens at stabilized traffic. |
Payroll can move the economics quickly because an FEC needs customer service, supervision, cleaning, party support, management, and potentially food-service staff whenever the building is operating. The U.S. Bureau of Labor Statistics reported seasonally adjusted average hourly earnings of $22.65 for all employees in amusement parks and arcades in April 2026. The category covers businesses beyond indoor FECs, and local rates may be substantially different, but it is a useful reminder that staffing assumptions should be based on current labor conditions rather than an old business plan.[2]
The correct payroll estimate is not simply hourly wage multiplied by opening hours. Include payroll taxes, benefits where applicable, training, management coverage, overlap between shifts, opening and closing time, breaks, party peaks, school holidays, and additional personnel required by individual attractions or local safety rules.
A venue rarely moves from opening day to stable monthly revenue immediately. Launch marketing, introductory discounts, training inefficiency, early maintenance adjustments, seasonal variation, and slower-than-planned party bookings can all create a gap between projected profitability and actual cash in the bank.
Working capital therefore belongs in total project investment when calculating a realistic payback period.
The most profitable attraction is not necessarily the one with the highest ticket premium. Equipment should be judged by who uses it, how much floor and vertical space it consumes, how many people it can serve, how long guests remain engaged, how much staffing it needs, and whether it gives families a reason to return.
For projects centered on children and families, I’d usually start the planning conversation around a combination rather than a single attraction type. Injbell's commercial indoor playground systems, for example, can be planned alongside trampoline, toddler, or challenge elements rather than treating each category as an isolated purchase.
Multi-level soft play can use vertical volume effectively and provide many activities inside a defined footprint. It is particularly relevant where the primary customer base includes younger children and parents who prefer longer free-play sessions.
The commercial question is how the structure affects visibility, cleaning access, capacity, evacuation routes, supervision, and the circulation of different age groups. A larger structure is not automatically a better structure if dead-end areas or narrow transitions reduce usable capacity.
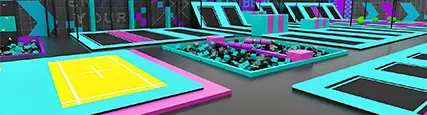
Trampoline parks can broaden the age profile and create high-energy attractions for older children, teenagers, and adults. They also require a different level of operational planning because jump courts, high-performance areas, foam or airbag landings, and challenge features can have specific inspection and supervision requirements.
Buyers comparing a trampoline component can review Injbell's commercial trampoline park equipment to understand the types of activity zones that can be incorporated into a larger FEC layout.

Separating activity zones on the plan makes capacity, circulation, supervision, and future revenue analysis easier before construction begins.
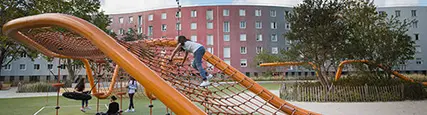
Ninja-style courses can add progression and competition to a venue. They are especially useful when the concept needs something beyond passive free play for older children or repeat customers. The strongest designs offer obstacles with different challenge levels instead of making every activity suitable only for the most athletic visitor.
A modular configuration can also help when the building has good ceiling height but limited floor area. Injbell's indoor ninja course configuration shows one approach combining a multi-level challenge structure with another activity inside a planned entertainment footprint.
Toddler zones rarely need the most expensive equipment in the building, but they can be strategically important. A separated, age-appropriate area makes the facility more practical for families with siblings of different ages and can expand the customer base during weekday periods.
The important word is separated. Placing small children directly beside uncontrolled high-energy circulation creates avoidable operating problems. Access, visibility, seating, shoe storage, sanitation, and adult supervision should all be considered.
| Attraction | Main Audience | Space Economics to Review | Operating Issue to Review | Commercial Role |
|---|---|---|---|---|
| Multi-level soft play | Children and families | Uses vertical space; compare playable volume with footprint | Cleaning, sightlines, access, age separation | Core admission and repeat family visits |
| Trampoline zone | Children, teens, adults | Requires meaningful clear floor area and suitable height | Supervision, inspection, controlled participation | Broader age reach and high-energy play |
| Ninja course | Older children and teens | Can use vertical space and linear challenge routes | Difficulty levels, fall zones, throughput | Progression, competition, repeatability |
| Toddler soft play | Younger children | Moderate footprint; should be deliberately separated | Sanitation and age control | Family inclusiveness and weekday use |
| Interactive/add-on games | Varies by product | Often smaller footprint | Technology maintenance and payment integration | Incremental spending and novelty |
Floor area alone does not tell you how many customers an FEC can serve comfortably. Two venues with identical square footage can have very different revenue capacity because columns, ceiling height, access, party rooms, circulation, queue areas, toilets, kitchens, reception, and unusable corners consume space differently.
A financially useful layout separates gross building area from productive customer area. It then asks how many guests each attraction can serve and how customers move from arrival to check-in, shoe change, play, food, parties, bathrooms, and exit.
Unused space is paid for through rent and build-out while generating no direct customer value. Poor circulation can be just as costly. A narrow passage that creates queues may reduce the effective capacity of an attraction even though the attraction itself is large enough.
Sightlines matter as well. Parents often spend significant portions of a visit outside the play structure. Seating that can see the primary play zones can improve the practical experience without requiring adults to continually relocate around the building.
Weekend afternoons, school breaks, and birthday periods may create the highest demand, but it is rarely sensible to size every part of the business around a few extreme hours. The design should identify which resources become constrained first: reception, parking, shoe storage, party rooms, tables, food service, toilets, or individual play zones.
For a larger mixed-attraction project, the 1,500-square-meter FEC playground and trampoline concept is useful for visualizing how multiple activity areas can be planned within one entertainment center. The commercial assumptions for any real project still need to be built from its own floor plan and local market.

Vertical design can increase activity density, but access, fall protection, structural loads, supervision, and local code requirements still govern the usable solution.
I think one of the most useful planning exercises is calculating revenue against whichever resource is actually scarce. For a party business, that may be party-room hours. For timed trampoline sessions, it may be safe participant capacity per hour. For a premium course, it may be participants per operating cycle.
That gives management something more useful than revenue per square foot alone. The metric identifies what is stopping the venue from selling another ticket or booking.
The following model is deliberately hypothetical. It is not an Injbell customer result, an industry average, a revenue promise, or a forecast for a particular project. I’d use a model like this to understand which assumptions control the investment before requesting final equipment and construction quotations.
| Revenue Source | Assumption | Annual Revenue |
|---|---|---|
| Admissions | 72,000 paid visits × $18 realized admission | $1,296,000 |
| Birthday/private events | 900 events × $350 average package revenue | $315,000 |
| Food and beverage | 72,000 visits × $5 average spend | $360,000 |
| Arcade and paid add-ons | 72,000 visits × $4 average spend | $288,000 |
| Groups and other revenue | Model assumption | $90,000 |
| Total annual revenue | $2,349,000 |
Notice that the model does not assume every family buys everything. Food and add-on revenue are expressed as averages across total visits. Some guests may spend much more and others nothing.
| Expense | Annual Model Amount |
|---|---|
| Facility occupancy | $360,000 |
| Payroll and related labor cost | $720,000 |
| Food, merchandise, prizes and other direct costs | $230,000 |
| Utilities | $150,000 |
| Maintenance and replacement parts | $95,000 |
| Insurance, permits and licenses | $110,000 |
| Marketing | $125,000 |
| Software, payment fees and administration | $115,000 |
| Cleaning and operating supplies | $75,000 |
| Total operating expenses | $1,980,000 |
The illustrative operating surplus is therefore:
$2,349,000 − $1,980,000 = $369,000
If total invested capital were hypothetically $1.8 million:
Simple operating ROI = $369,000 ÷ $1,800,000 = 20.5%
Simple payback = $1,800,000 ÷ $369,000 = approximately 4.9 years
Again, the percentages come only from the assumptions shown above. They are not expected FEC returns. Financing costs, depreciation, taxes, owner compensation, major replacement capital, and changes in working capital have not been deducted.
Many feasibility models look impressive because traffic, admission prices, parties, food sales, and add-on spending all reach planned levels at the same time. Real operations rarely cooperate that neatly.
I’d recommend testing at least three cases while changing both revenue and expenses. Lower attendance does not reduce rent, management salaries, insurance, software, or minimum staffing in the same proportion.
| Scenario | Annual Revenue | Operating Expenses | Operating Surplus | Simple ROI on $1.8M Investment |
|---|---|---|---|---|
| Conservative case | $1,648,250 | $1,550,000 | $98,250 | 5.5% |
| Base case | $2,349,000 | $1,980,000 | $369,000 | 20.5% |
| Higher-volume case | $3,097,500 | $2,350,000 | $747,500 | 41.5% |
The table is useful because it exposes operating leverage. A relatively modest difference in visitor traffic and secondary spending can create a much larger difference in surplus after fixed expenses.
A useful next step is separating expenses into fixed and variable categories.
Break-even visits = Annual fixed costs ÷ Contribution per visit
If the average visit generates $28 of visit-related revenue and $7 of variable costs, contribution is $21 before fixed expenses. If annual fixed operating expenses are $1.26 million, the simplified break-even calculation is 60,000 paid visits.
$1,260,000 ÷ $21 = 60,000 visits
Party revenue and other non-visit sales can be modeled separately. The purpose is not to produce a perfect answer; it is to understand how much demand the project must generate before committing capital.
An equipment supplier should be evaluated against the economics and execution risk of the entire project, not only factory price. A lower quotation can become expensive if the design does not fit the building, shipping scope is unclear, installation documentation is weak, replacement parts are difficult to identify, or required technical documents arrive too late for inspections.
For this comparison, I’m prioritizing six areas.
Layout capability: Can the manufacturer design from an actual CAD floor plan, ceiling heights, columns, entrances, exits, and restricted areas?
Documented specifications: Are materials, dimensions, components, electrical requirements, anchoring, and included items clearly defined?
Safety documentation: Can the supplier identify the standards relevant to the specific equipment and provide the documents needed for the project?
Manufacturing scope: Is it clear which equipment is manufactured, supplied, subcontracted, or purchased from third parties?
Installation support: Are drawings, assembly instructions, supervision responsibilities, local labor needs, and completion procedures defined?
After-sales support: Can the operator identify wear parts, order replacements, and obtain technical assistance after opening?
Injbell manufactures commercial indoor playground, soft-play, trampoline, ninja-course, and related amusement equipment and provides project support covering design, production, shipment, installation, and after-sales service. That range is especially useful for mixed FEC concepts because several major attraction categories can be coordinated inside one layout.
For buyers who want the process coordinated from the initial floor plan through installation, Injbell's indoor playground turnkey process explains how design, equipment configuration, manufacturing, logistics, and installation support can be organized.
I’d still recommend treating every project as its own technical procurement. Ask for the exact bill of materials, final drawings, equipment specifications, applicable test or certification documents, installation scope, freight terms, spare-parts information, and warranty terms in writing before approving production. A manufacturer name alone does not replace project-specific due diligence.
Dimensioned CAD floor plan rather than a phone photo of the space.
Clear ceiling height and any areas with different heights.
Column locations and dimensions.
Entrances, emergency exits, stairs, elevators, bathrooms, and restricted rooms.
Target age groups.
Expected attraction categories.
Party-room, café, seating, reception, storage, and circulation requirements.
Applicable local codes or documentation requests already identified by the architect or authority having jurisdiction.
Target opening date and delivery location.
Total equipment budget rather than only a target price per square foot.
A detailed request makes quotations easier to compare because suppliers are pricing closer to the same scope.
Safety should never be reduced to a return calculation, but poor safety planning has direct financial consequences. Redesign, inspection delays, rejected installations, downtime, repairs, higher insurance difficulty, and reputational damage can all affect the business long after the equipment invoice is paid.
For U.S. projects, ASTM International's ASTM F1918-21 is the active safety performance specification for soft contained play equipment. Its scope covers safety and performance requirements for soft contained play equipment and includes areas such as materials, performance, access and egress, structural integrity, maintenance, fire safety, and evacuation.[3]
That does not mean every item inside a family entertainment center falls under F1918. Different equipment can fall under different standards, which is exactly why the final attraction list matters before compliance documentation is reviewed.
ASTM's current F2970-25 practice covers the design, manufacture, installation, operation, maintenance, inspection, and major modification of commercial or institutional trampoline courts. ASTM specifically lists family entertainment centers among the facilities within its scope.[4]
I’d recommend confirming the standard edition and local adoption requirements with the project's qualified professionals rather than relying on a generic statement that equipment is "ASTM compliant."
Accessibility belongs in early layout planning rather than being added after the equipment plan is complete. The U.S. Department of Justice's 2010 ADA Standards contain requirements affecting recreational facilities, play areas, accessible routes, amusement rides, load and unload areas, and other building elements.[5]
European projects may need to consider EN 1176 and other relevant equipment, building, fire, electrical, and accessibility requirements as adopted in the destination country. Canada, Australia, New Zealand, and other markets likewise have their own requirements. The manufacturer, architect, engineer, installer, insurer, inspection body, and local authority may each be responsible for different parts of the approval process.
No international equipment standard replaces local building permits, fire approval, electrical inspection, occupancy requirements, food-service rules, employment obligations, or insurance conditions.
A business plan should turn into an operating dashboard after opening. Otherwise management can see total monthly sales rising without understanding whether higher labor, discounting, repairs, or low-margin revenue are reducing the actual return.
Track admissions separately from food, arcade, merchandise, and other secondary purchases. This shows whether increases in attendance also create increases in total customer value.
Measure available sellable party sessions, booked sessions, package revenue, food cost, host labor, and contribution. A room that appears busy on Saturday may still have substantial unused inventory across the week.
Monthly labor percentage can hide scheduling problems. Track labor against revenue or attendance by weekday, weekend, school holiday, opening hour, and closing hour. The objective is not understaffing. It is matching trained staff to actual operating demand while maintaining required supervision and customer service.
Downtime should be measured by attraction and cause. If a popular paid attraction repeatedly closes because a replacement component is unavailable, the real maintenance cost includes lost sales and customer dissatisfaction, not just the price of the part.
Track replacement materials, technician time, inspection findings, consumables, and recurring failure points. This makes future equipment purchases more informed because lifecycle cost becomes visible.
A beautiful opening month does not guarantee long-term performance. Membership usage, customer accounts, booking data, loyalty programs, and properly collected first-party data can help distinguish repeat customers from one-time launch traffic, subject to applicable privacy requirements.
| Metric | Why It Matters | Action When It Moves the Wrong Way |
|---|---|---|
| Paid visits | Shows traffic volume | Separate market-demand issues from capacity or booking problems. |
| Revenue per visit | Measures monetization beyond traffic | Review pricing, bundles, food, add-ons, and sales conversion. |
| Labor cost per visit | Links staffing to activity | Review schedules while preserving required supervision. |
| Party contribution | Shows whether party revenue is truly profitable | Review package pricing, food cost, host labor, and room turnover. |
| Maintenance cost per zone | Reveals lifecycle cost | Identify repeat failures and stock critical parts. |
| Downtime hours | Shows lost attraction availability | Investigate inspection, spare-parts, training, and design issues. |
| Repeat visits | Tests whether the concept has staying power | Review programming, attraction refresh, service, and membership value. |
Equipment procurement becomes much easier when the financial model and building plan are developed together. I’d recommend reaching the following checkpoints before paying a production deposit.
Confirm total project capital. Include construction, equipment, freight, installation, technology, professional fees, opening inventory, pre-opening payroll, and working capital.
Build a monthly model. Annual averages can hide seasonality and cash shortages.
Separate fixed and variable expenses. This allows a meaningful break-even analysis.
Use a conservative traffic case. Confirm the project can still meet obligations if opening demand is weaker than planned.
Define each attraction's customer role. Avoid purchasing multiple expensive zones that all serve the same narrow audience.
Calculate capacity before finalizing ticket prices. A pricing strategy is only useful if the facility can deliver the promised experience at expected attendance.
Price local building work early. Equipment design can affect electrical, sprinkler, HVAC, floor, anchoring, and access requirements.
Review applicable standards before production. Resolve documentation questions while design changes are still practical.
Confirm installation responsibilities. Identify which work belongs to the equipment installer and which requires local licensed trades.
Request spare-parts information. A low-cost component can create expensive downtime if replacement lead time is long.
Plan party operations before allocating rooms. Confirm service routes, food handling, storage, cleanup, and room turnover.
Leave room for operational circulation. Every square foot does not need to contain an attraction.
Model financing separately. Project operating return and return on owner equity are not the same measurement.
Document assumptions. Traffic, ticket price, labor, rent, parties, and secondary spending should each have a clearly stated basis.
A profitable FEC is therefore less about finding one spectacular attraction and more about making hundreds of connected decisions work together. The equipment has to attract the right customers, the layout has to process them safely, the pricing has to support the experience, secondary revenue has to add margin, and the total investment has to remain proportionate to achievable cash flow.
If I were choosing between two proposed FEC concepts, I’d rank the concept with the more defensible downside case above the concept with the most aggressive revenue forecast. A project that still works when traffic is slower, payroll is higher, or construction costs increase has more room to survive normal business variation.
That is the central answer to what makes a family entertainment center profitable: productive capacity, repeatable customer spending, disciplined fixed costs, reliable operations, and a capital budget sized to the cash flow the local market can realistically support.
It can be, but profitability is not guaranteed by the attraction category. A viable FEC needs sufficient traffic and customer spending to cover labor, rent, utilities, maintenance, insurance, marketing, direct costs, administration, and replacement capital. The investment also needs to be reasonable relative to the operating cash the facility can generate. Build conservative, base, and higher-volume cases before committing capital.
A simple operating calculation divides annual operating cash surplus by total invested capital. For example, a $1.8 million project generating $360,000 of annual operating surplus would produce a 20% simple operating ROI. For a complete investment decision, also model financing, taxes, depreciation, replacement capital, working capital, and discounted cash flow.
There is no responsible universal payback period. Divide total invested capital by annual operating cash generation to calculate a simple project-specific payback. Then run downside cases because attendance, labor cost, rent, party bookings, maintenance, and secondary spending can change the result substantially.
Major categories commonly include occupancy, payroll, utilities, insurance, maintenance, cleaning, marketing, payment processing, software, food or prize costs, permits, and administration. The ranking varies by market and concept. Payroll and occupancy deserve especially detailed modeling because large portions of those costs remain even when attendance is below plan.
There is no single best equipment category. Soft play can support younger families and use vertical space efficiently; trampoline areas can broaden the age range; ninja courses can add progression and challenge; toddler zones can make the venue useful to families with younger children. I’d choose the mix that covers distinct customer segments without duplicating expensive capacity.
Do not allocate floor area using a fixed percentage without first planning circulation, reception, party rooms, seating, bathrooms, food service, storage, staff areas, emergency access, accessibility, and building systems. Productive layout depends on the actual building. Start with a dimensioned floor plan and calculate attraction capacity and customer flow before maximizing equipment coverage.
Request final drawings, material specifications, equipment dimensions, applicable safety documentation, electrical requirements, anchoring information, installation responsibilities, freight terms, packing details, spare-parts information, after-sales procedures, production scope, and written commercial terms. Confirm local code requirements independently with qualified project professionals.
I’d recommend at least completing a preliminary equipment and feasibility layout before making an unconditional long-term lease commitment. Ceiling height, columns, structural conditions, exits, HVAC, sprinklers, electrical capacity, bathrooms, accessibility, parking, permitted use, and local approvals can materially affect both equipment selection and total project cost.
This guide is prepared from the procurement and equipment-planning perspective of Injbell, a manufacturer of commercial indoor playground, soft-play, trampoline park, ninja-course, and related amusement equipment. The editorial method used here prioritizes practical project economics, equipment configuration, safety documentation, installation scope, and lifecycle operating considerations rather than treating equipment price as the sole purchasing criterion.
U.S. Census Bureau, Quarterly Services Survey, Third Quarter 2025, including revenue estimates for NAICS 7131, Amusement Parks and Arcades. U.S. Census Bureau source.
U.S. Bureau of Labor Statistics, Table B-3a: Average Hourly and Weekly Earnings of All Employees on Private Nonfarm Payrolls by Industry Sector, 2026 data. U.S. Bureau of Labor Statistics source.
ASTM International, ASTM F1918-21: Standard Safety Performance Specification for Soft Contained Play Equipment. ASTM F1918-21.
ASTM International, ASTM F2970-25: Standard Practice for Design, Manufacture, Installation, Operation, Maintenance, Inspection and Major Modification of Trampoline Courts. ASTM F2970-25.
U.S. Department of Justice, 2010 ADA Standards for Accessible Design. ADA Standards.




 EN
EN ES
ES AR
AR

